Dyna — Automatic printable planner generator
Web app that turns a planner design into a print-ready PDF in minutes, with the correct dates for any year. Born from a very specific problem I lived with for years as a creator of my own planners.
- Product Engineering
- Visual editor
- Tools for creators
- React/TS
The problem
I have spent about 5 years designing my own planners. At first I used “blank” templates — the typical undated planner where you fill in the gaps by hand — but they had a fundamental flaw: they assumed the same number of weeks for every month, so they never fit the real calendar well.
The alternative was to design complete planners in Canva, with dates already in place. Better result, but a huge cost: every quarter I had to review and update dates, duplicate and delete pages manually, page by page. Between checking and adjusting, the process took me about 8 hours each time — just to update something that, conceptually, is pure calendar logic.
Dyna was born from automating exactly that step: you design your planner once, mark where each piece of data goes (year, month, day…), and generate the updated PDF for any date range in seconds.
The product
The user flow, end to end:
- 1
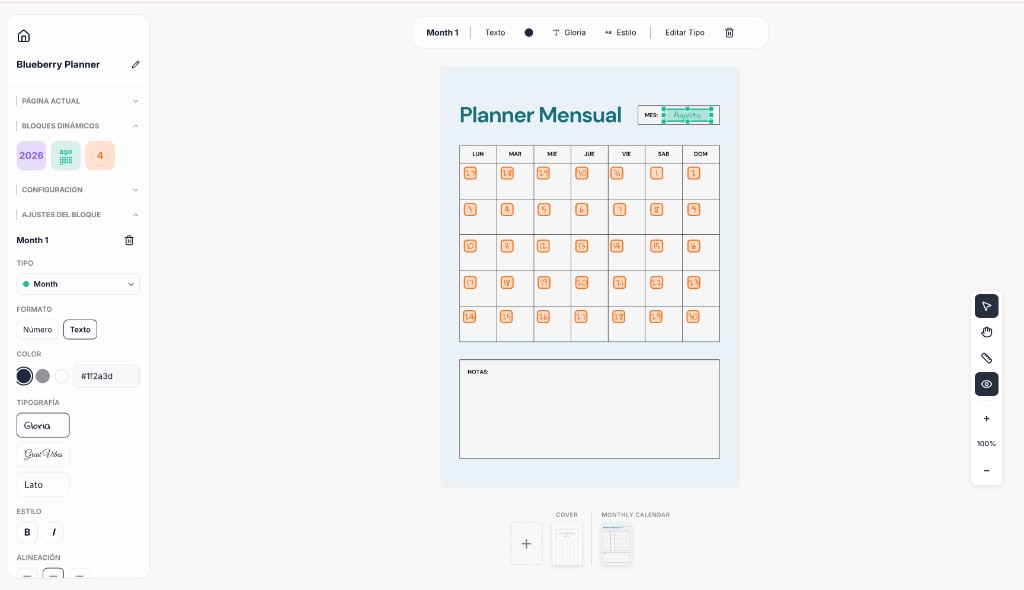
Create project
Name + paper size (A4/A5, portrait/landscape).
- 2
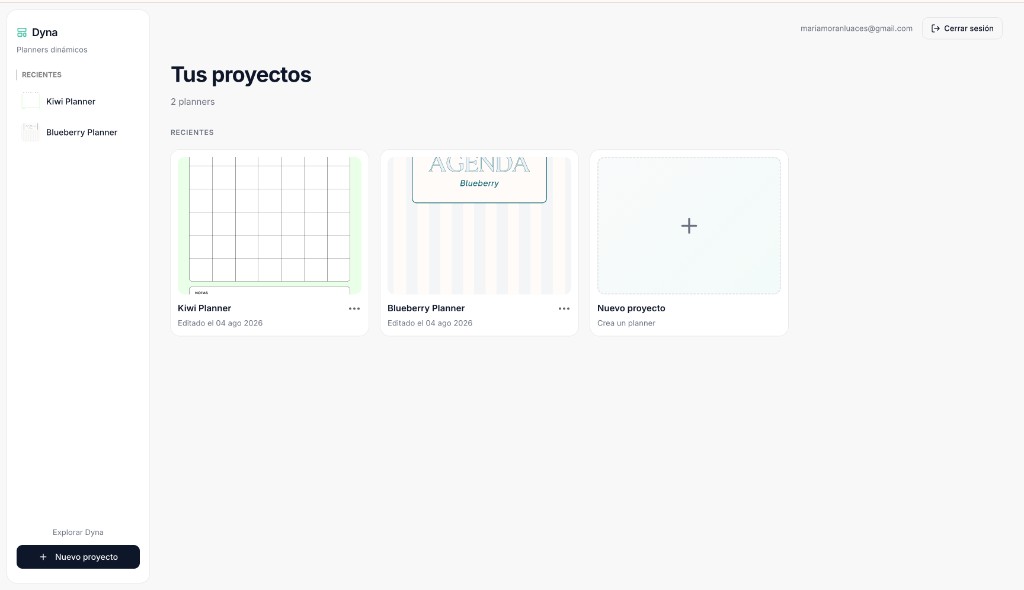
Upload design
One image (PNG/JPG/WebP) per planner page type: cover, monthly, weekly, daily...
- 3
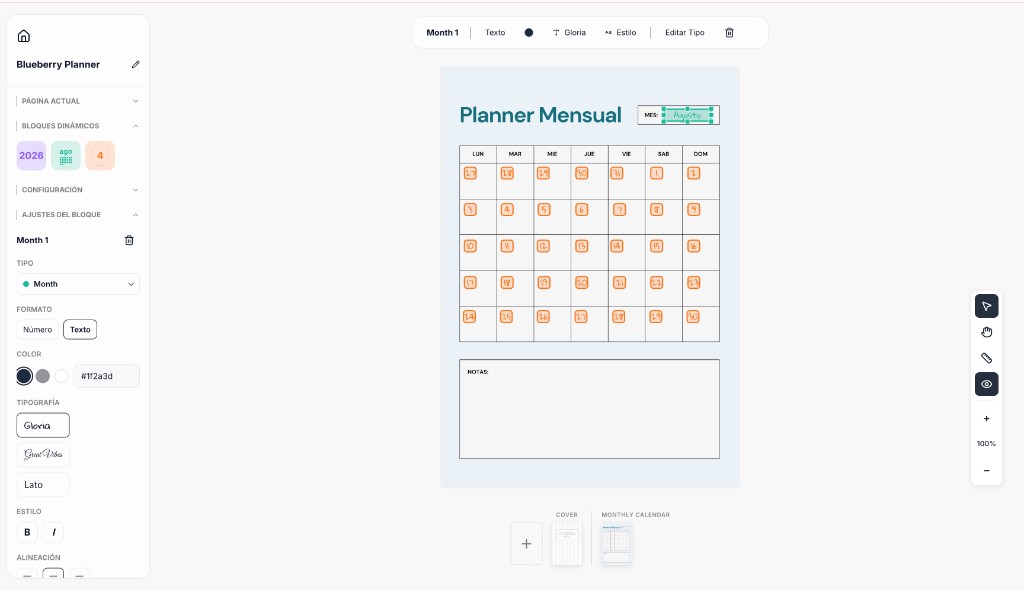
Mark dynamic zones
Draw rectangles on the design and indicate what each one represents: year, month, day, week start/end.
- 4
Configure
Calendar language (EN/ES), first day of the week (Monday/Sunday), text styles.
- 5
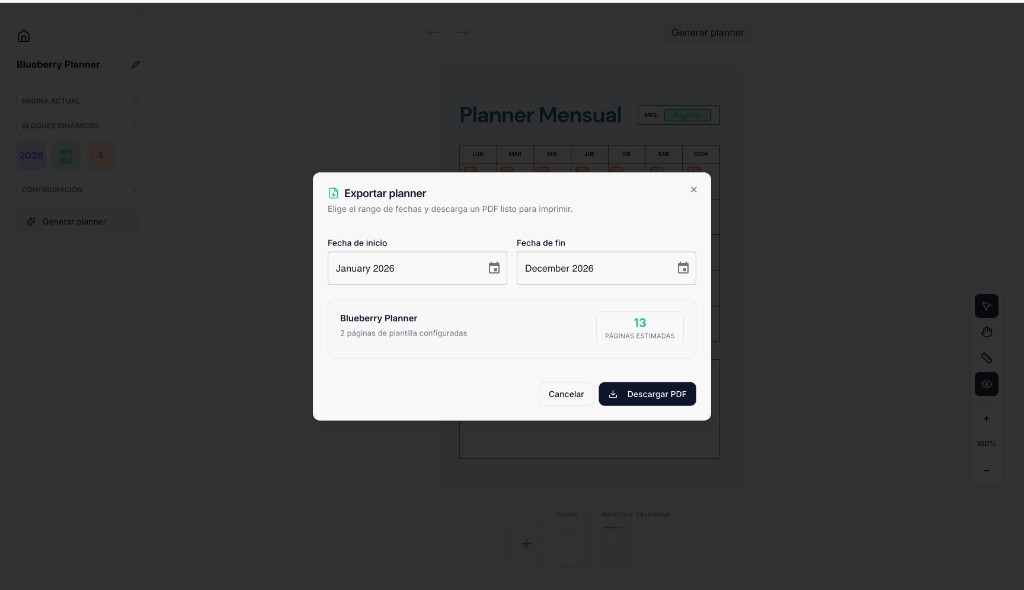
Choose range
Start and end month/year. The app estimates how many pages will be generated.
- 6
Export
Everything is processed in the browser and downloads the final PDF, with a progress bar.
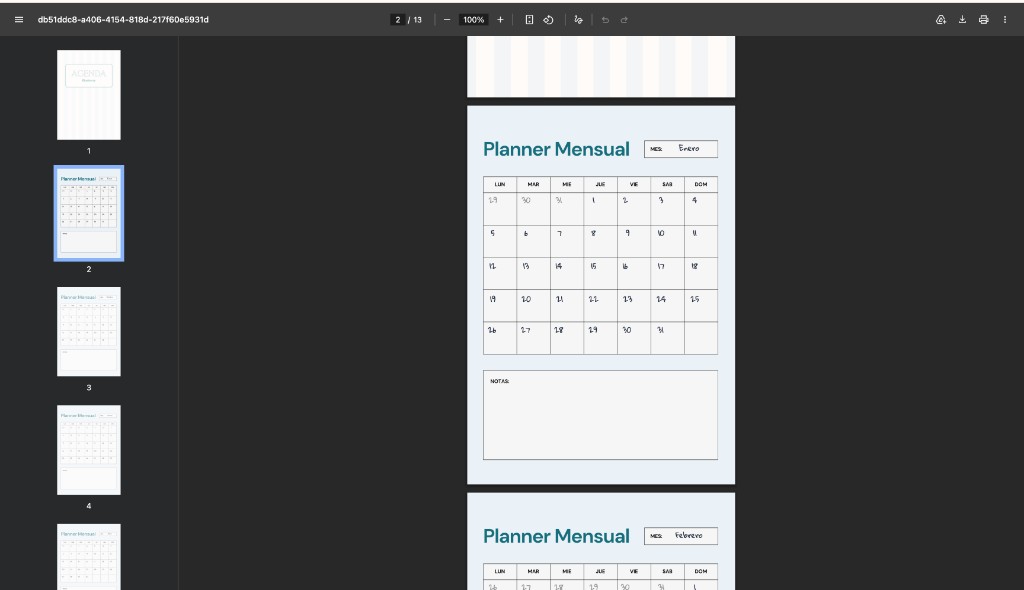
There is also a public demo without registration (/landing-demo/home) with sample templates, so anyone can try the flow without friction.
The technical challenge
This is the core of the project: turning a static design into a dynamic template that generates correct calendars for any date while maintaining print quality.
1. Zone marking: a Figma-like visual editor
Zone marking was solved with Konva + react-konva (high-level HTML5 canvas) instead of pure SVG or Fabric.js. The user draws rectangles on the image, resizes them with handles, and can use a grid tool that generates several blocks at once from a single drag — key for quickly mapping a 7×5 monthly grid. There is also multi-selection with marquee and automatic alignment guides (snap), Figma-style.
Each zone is stored as absolute pixel coordinates relative to the original image — not as percentages:
interface Rectangle {
  x: number;
  y: number;
  width: number;
  height: number;
  fieldType: 'year' | 'month' | 'day' | 'startDay' | 'endDay';
  order: number; // order for mapping days in grids
}
The real challenge here was making sure editor zoom and pan did not misalign marked zones. The solution: coordinates always live in the original image space, and only the view is scaled visually. Pointer-to-image coordinate conversion is as simple as this:
const pointerToImage = useCallback(
  (pos: { x: number; y: number }) => ({
    x: (pos.x - offset.x) / scale,
    y: (pos.y - offset.y) / scale,
  }),
  [offset, scale]
);
2. Generating the correct calendar
The date engine relies on date-fns:
getMonthsBetween(start, end)generates the list of months in the chosen range.- For each month,
getCalendarWeeksandgetMonthDatesForGridcalculate full weeks and the monthly grid, respecting the configured week start day. getFieldValueresolves what text goes in each marked block, according to itsfieldTypeand context (year, month, week, or specific day).- “Leading/trailing” days (from the previous or next month that appear in a monthly view) are rendered in a secondary color to differentiate them.
The system supports 6 page types (cover, monthly divider, monthly view, weekly view, daily view, extras), and the generation order mirrors how a planner is used in real life: covers → for each month, divider + monthly view → if there are weekly and daily views, for each week the week is generated and then only the days of that week that fall in that month → extra pages at the end.
It also supports full i18n: English/Spanish language (with date-fns locales), year format (2026 vs 26), month format (January vs 1), and day format (6 vs Monday), all configurable per template.
3. From canvas to printable PDF
Export is 100% client-side, in two phases:
- Page rasterization — each page is painted on an HTML Canvas 2D (background image + date text) and converted to base64 PNG.
- PDF assembly — with
pdf-lib, running in a Web Worker to avoid blocking the main thread, each PNG is embedded as a PDF page at the real size in points (for example, 595×842 pt for A4).
To maintain print quality, the system assumes 300 DPI by default and automatically detects whether the uploaded design corresponds to A4 or A5 by comparing its pixel dimensions against several known DPIs (72/96/144/150/300).
An annual planner with a daily view can generate hundreds of pages, so the bottleneck is rasterization. To mitigate it: visible progress in two phases (85% generation + 15% assembly), cache of already generated pages if the range does not change, and a prior estimate of the number of pages before starting export.
Stack
Feature-sliced + hexagonal architecture, with ports/adapters separated by module (auth, template, editor, export, landing) — which allowed the generation core (marking → date calculation → PDF) to be independent of the persistence layer.
Result
From ~8 manual hours per quarter in Canva to a process of minutes: upload the design once, mark the zones once, and generate any date range whenever needed.
Current status and next steps
Dyna is in early access: the full core works (upload → mark → generate → PDF), with access managed by waitlist and a public demo without registration. It is desktop-first for now (designed for viewports ≥ 900×560px).
I have not validated the product with other creators yet — it is a tool that solves my own problem, and that would be the next logical step: take it beyond my personal use case and test it with other people who design planners.
Pending roadmap:
- Collaboration and shared planners
- Library of pre-designed templates
- Mobile/tablet optimization
- Bleed and color profiles for professional printing
- Parallelization of page generation (performance)
Live project: planner-maker-spa.vercel.app
Try it yourself
The interactive demo works without signing up — upload a design, mark a few zones, and see the generation flow in under two minutes.